Let's Shape The Future Of Your Investments!
Natoque iaculis cursus augue urna commodo aptent morbi tortor porttitor quis ornare.
![Lithium-ion Battery Manufacturer | BAKTH Battery [Official]](https://bakth-battery.com/wp-content/uploads/2026/05/hideLogo.png)
![Lithium-ion Battery Manufacturer | BAKTH Battery [Official]](https://bakth-battery.com/wp-content/uploads/2026/05/logo.png)
If you’re working with lithium-ion cells for R&D, battery design or product specification, calculating battery capacity correctly is critical. Many engineers and researchers confuse mAh capacity with energy (Wh), leading to flawed material comparisons or incorrect performance predictions. This guide breaks down core formulas, the gap between theoretical and practical capacity, C-rate impacts, and best practices for reliable lab capacity testing.
Battery capacity represents the total charge a cell can store and release during cycling, quantified in ampere-hours (Ah) or milliampere-hours (mAh). When evaluating raw electrode materials, we use specific capacity (mAh/g), normalised against active material mass to compare different cathode and anode chemistries fairly.
While full battery packs rely on gravimetric or volumetric energy density (Wh/kg, Wh/L), these metrics are built directly from the cell’s base capacity value. The figure reflects reversible lithium-ion intercalation within electrode crystal structures, the fundamental chemical mechanism behind lithium-ion power storage.
The theoretical specific capacity of battery active materials follows Faraday’s law:
Q = (n × F) / M
– n = moles of transferred electrons per formula unit
– F = Faraday constant (96485 C/mol)
– M = molar mass of active material (g/mol)
Convert coulombs per gram to mAh/g by dividing the result by 3.6.
Two widely used examples:
1. Graphite (LiC₆): n=1, theoretical specific capacity ~372 mAh/g
2. LFP (LiFePO₄): n=1, theoretical specific capacity ~170 mAh/g
Theoretical capacity assumes perfect, full utilisation of all lithium storage sites. Real cells never hit this ideal benchmark, due to physical and chemical limitations inside electrodes.
A common industry mistake is treating mAh and Wh as interchangeable values.
– mAh / Ah = total charge capacity
– Wh = total deliverable energy
Wh = Ah × average discharge voltage
Example: A 1000 mAh cell with 3.6V average discharge voltage stores 3.6 Wh of energy.
Two cells can share identical mAh capacity but differ drastically in usable energy if their operating voltage profiles diverge. Always combine capacity and voltage when comparing energy storage performance.
Practical capacity always sits below theoretical limits, caused by irreversible electrochemical side reactions and physical degradation:
Coulombic efficiency, the ratio of discharged charge to charged charge, tracks these losses cycle-by-cycle. Stable, high coulombic efficiency signals minimal irreversible degradation, a core benchmark for new electrode material screening.
C-rate defines charge or discharge current relative to a cell’s rated capacity, and it directly alters measured capacity.
At higher C-rates, lithium ions cannot diffuse fast enough through electrode solids. Higher overpotential triggers early voltage cut-off, lowering deliverable capacity.
– Low C-rate (C/20): Near equilibrium conditions, capacity approaches the practical maximum.
– C/2 or 1C: Ion diffusion limitations kick in, reducing measured output.
Rate capability testing plots capacity across varying C-rates, revealing kinetic constraints within electrodes and electrolyte. Always record the C-rate used during testing; omitting this detail makes cross-study comparisons invalid.
Consistent, repeatable capacity testing relies on strict experimental controls:
– Precisely weigh active electrode mass; exclude binders and conductive additives from specific capacity calculations.
– Ensure full electrolyte wetting; insufficient electrolyte yields falsely low capacity readings.
– Stabilise cell temperature during all tests, as temperature strongly impacts ion mobility.
– Lock fixed upper/lower voltage cut-offs for comparative tests.
– Standardise formation cycles to stabilise SEI growth before recording final capacity.
Half-cell testing with lithium metal counter electrodes is standard for academic material research. Still, half-cell results cannot be directly applied to full-cell designs without adjusting for lithium inventory and reference potential differences.
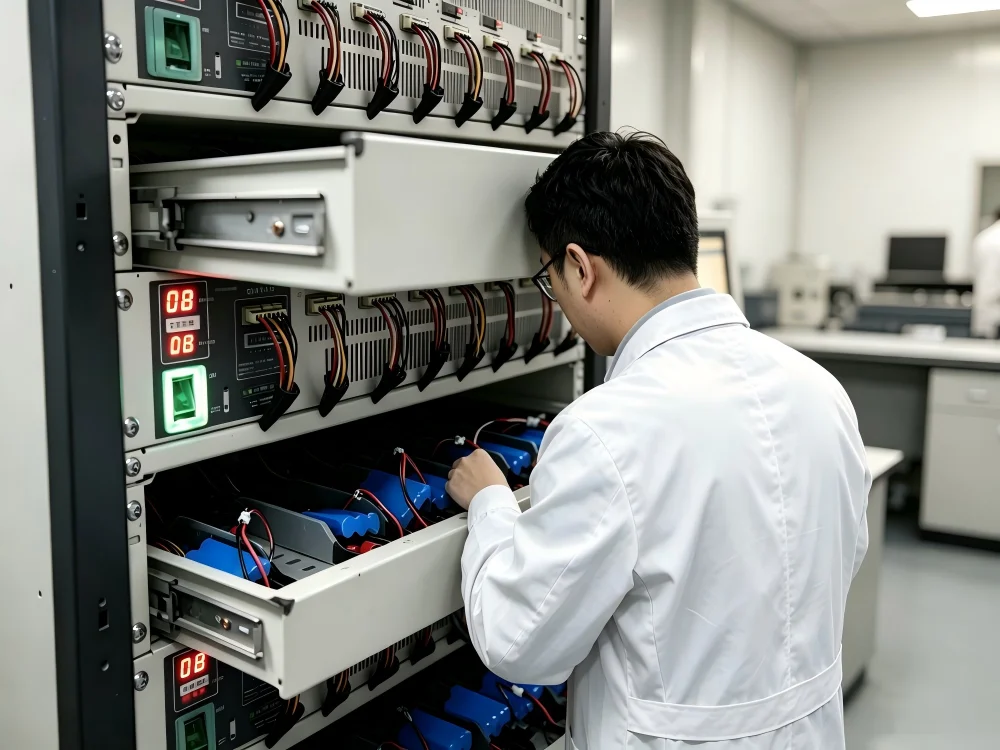
High-quality, repeatable capacity data depends on precision test hardware. Specialised electrochemical test systems reduce cell-to-cell variation in R&D labs:
– Standardised PAT-Cells for sealed, consistent test cell assembly
– Multi-channel battery cyclers with integrated temperature chambers for galvanostatic cycling and EIS testing
– Electrochemical dilatometers to monitor electrode thickness change alongside capacity fade
– Dedicated analysis software for automated cycling and traceable data logging
Whether you run academic material research or industrial battery development, matched test hardware removes variability and delivers trustworthy capacity measurement results. Reach out to battery test instrument suppliers to design your electrochemical characterisation workflow.
A: Practical discharge capacity = discharge current × discharge time, expressed in Ah/mAh. Theoretical material capacity uses Faraday’s law formula Q=(n×F)/M.
A: SEI formation, particle isolation, electrolyte decomposition and structural degradation consume lithium and block ion transport, limiting usable capacity.
A: Ah measures stored electric charge, while Wh measures total usable energy, calculated by multiplying Ah by the cell’s average discharge voltage.
A: Yes. Higher discharge C-rates increase overpotential, reduce deliverable capacity, so testing C-rate must always be documented.
A: Specific capacity normalises capacity by the mass of active electrode material, letting researchers compare different cathode/anode chemistries fairly.