Let's Shape The Future Of Your Investments!
Natoque iaculis cursus augue urna commodo aptent morbi tortor porttitor quis ornare.
![Lithium-ion Battery Manufacturer | BAKTH Battery [Official]](https://bakth-battery.com/wp-content/uploads/2026/05/hideLogo.png)
![Lithium-ion Battery Manufacturer | BAKTH Battery [Official]](https://bakth-battery.com/wp-content/uploads/2026/05/logo.png)
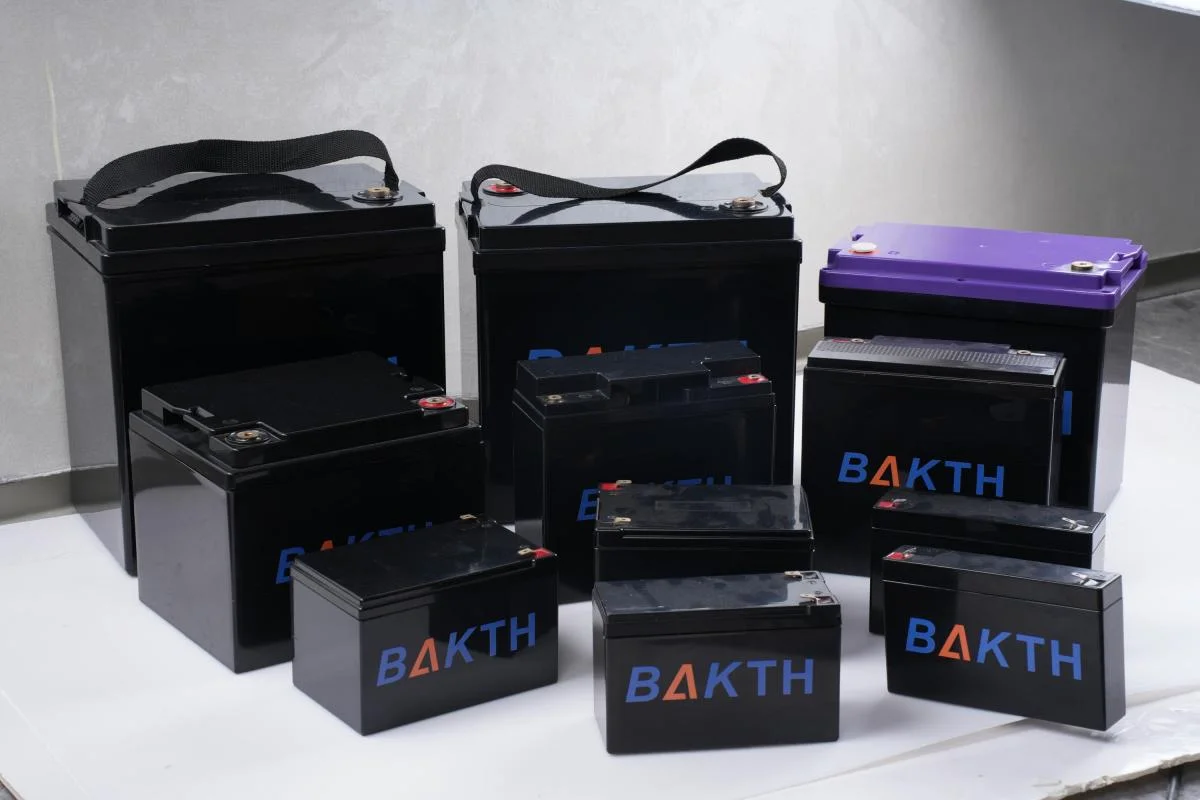
When your battery shows a full‑charge reading yet runs out of power far sooner than expected, hidden capacity loss is usually to blame. This common frustration ties directly to battery State of Health (SOH). While most users track charge percentage (SOC), understanding SOH unlocks accurate runtime predictions, early degradation detection and smarter battery‑replacement decisions. This guide breaks down battery health, how you measure it, and why it matters for lithium‑ion, lead‑acid, RV, marine, off‑grid and EV battery systems.
State of Health (SOH) measures a battery’s present‑day performance against its factory‑new baseline, displayed as a percentage value. A brand‑new battery typically starts at ~100 % SOH. As internal chemical wear accumulates over months and years, this percentage slowly falls.
Unlike voltage, amps or temperature readings, SOH cannot be read directly by a multimeter. Technicians and battery monitors calculate or estimate health by comparing real‑world battery behaviour to its original specifications.
There is no single universal definition for SOH across all industries. Depending on your equipment, SOH can refer to one or more of these key benchmarks:
The most widely‑used, capacity‑focused SOH formula:
SOH = (Measured Current Capacity ÷ Original Baseline Capacity) × 100
Example: A 100 Ah deep‑cycle battery that delivers 86 Ah in a controlled discharge test has an SOH of 86 %.
Note: Testing conditions including ambient temperature, discharge speed and cut‑off voltage will change your final result. Whenever possible, compare results to a capacity test completed on your battery on its first day of use, rather than only using the printed nameplate rating.
These two battery metrics are frequently mixed‑up, yet they answer completely separate questions about your battery pack.
The classic smartphone example explains this perfectly: your old phone displays 100 % battery after charging, yet dies halfway through the day. Its SOC reads full, but its SOH has dropped significantly. This same issue causes unexpected early shutdowns for off‑grid battery banks and electric vehicles.
Many battery monitors calculate remaining runtime based on your battery’s factory‑stated amp‑hour rating. Once capacity fades, this fixed setting creates inaccurate predictions.
Take this practical case: your 100 Ah battery degrades to 80 Ah usable capacity. At a displayed 50 % SOC, it only holds roughly 40 Ah of available energy, not the expected 50 Ah. If your shunt‑based battery monitor is still programmed for the original 100 Ah rating, it will consistently overestimate remaining power, and your battery may trigger low‑voltage protection long before your monitor hits zero percent.
Early shutdowns are not always caused by poor battery health. Cell imbalance, loose wiring, cold weather and heavy sudden loads can also create identical symptoms. Still, declining SOH should always form part of your troubleshooting checklist.
Monitoring battery health delivers tangible, real‑world benefits for home backup, marine fleets, EV owners and industrial operators alike:
Every rechargeable battery slowly loses health over time. The chemical aging process differs greatly between lithium‑ion and traditional lead‑acid chemistries.
Inside lithium‑based batteries, lithium ions travel back‑and‑forth between cathode and anode plates during charge‑discharge cycles. This movement creates minor mechanical expansion and contraction on electrode materials, eventually creating micro‑cracks and loss of active material contact.
Other common aging triggers:
A well‑configured BMS (Battery Management System) protects cells from overcharge, deep discharge and unsafe temperatures, slowing degradation, yet cannot stop natural calendar aging completely.
Deep‑cycle flooded, AGM and gel lead‑acid batteries suffer from a distinct set of aging problems, most famously sulfation.
When lead‑acid batteries sit partially discharged for long periods, lead sulfate hardens into non‑reversible crystals on the plates, permanently cutting usable capacity.
Additional lead‑acid failure modes:
Lead‑acid batteries generally degrade far faster than lithium batteries when regularly left in a partially‑charged condition.
There is no single perfect health‑testing method; technicians select techniques based on your battery’s primary purpose.
This method compares the battery’s real, measured discharge capacity against its baseline capacity. For deep‑cycle, off‑grid, RV and marine systems, capacity testing provides the most useful SOH result, directly linked to how long your battery will run your appliances.
The downside: controlled full discharge testing takes multiple hours and requires you to temporarily remove the battery from active service.
As batteries age, internal resistance rises, creating larger voltage drops under heavy‑load conditions. Resistance‑focused SOH testing evaluates how well a battery delivers high bursts of power. This measurement is ideal for starter batteries, high‑inverter loads and electric vehicles.
One important limitation: a battery can retain strong total storage capacity while suffering poor high‑current performance — and vice‑versa. Resistance data never tells you full runtime capacity on its own.
Modern smart BMS and EV battery systems calculate estimated SOH with complex mathematical models. These algorithms draw from a large pool of sensor data, including cycle history, charge throughput, temperature logs, voltage curves and internal resistance trends, to predict degradation without running a full manual discharge test.
This convenient estimation method is widely used for smartphones, EVs and grid‑tied energy‑storage systems. Keep in mind: these figures remain approximations and may diverge from results from a hands‑on capacity test.
This is the gold‑standard home‑testing workflow for deep‑cycle lithium‑iron phosphate and lithium‑ion battery packs:
Always test at the same discharge rate and temperature conditions used for your battery’s factory rating, to avoid skewed readings.
Safety note: Large commercial, high‑voltage battery banks should be inspected and capacity‑tested only by qualified battery technicians.
Many smart lithium‑ion battery packs display an SOH percentage inside their monitoring dashboard. Remember, your BMS does not directly “measure” battery health; it generates a calculated estimate. The accuracy improves when your battery regularly completes full charge‑discharge cycles. Many basic drop‑in lithium batteries include protection‑only BMS hardware that does not output any SOH data.
You can spot early degradation before completing formal testing if you notice:
Lead‑acid testing adds extra considerations, heavily affected by the Peukert effect: discharge speed drastically changes how much apparent capacity you can extract from the battery.
Always confirm what metric your SOH number was built on. An 85 % capacity‑based SOH score does not guarantee 85 % peak power delivery, and resistance‑based health values will not tell you remaining runtime.
Brand‑new batteries often deliver slightly more or less capacity than their printed label rating, due to normal manufacturing tolerances. Some BMS software caps displayed health values at 100 %, even if your initial capacity test measures above the nominal Ah rating.
80 % remaining capacity is the widely‑cited end‑of‑life benchmark for many rechargeable batteries, but it is not an automatic failure cutoff.
Once a verified capacity test confirms reduced usable capacity on your battery bank, you should adjust the programmed amp‑hour capacity value stored in your shunt‑based battery monitor. Refresh related settings including charge efficiency and Peukert exponent, then fully charge and synchronise your monitor.
Never lower your programmed capacity value based on one single unexpected early shutdown. Always troubleshoot wiring, temperature, load and cell‑balance issues first before concluding capacity loss is the root cause.
Full capacity testing is not required every few months. Schedule formal battery‑health evaluation when:
Tracking SOH trends over multiple tests delivers far more actionable insight than one‑off health measurements.
State of Health (SOH) gives you the clearest picture of long‑term battery aging. While your SOC gauge shows how much charge you have right now, SOH reveals how much of your battery’s original performance remains. Controlled discharge capacity testing offers the most trustworthy real‑world health reading for deep‑cycle power systems, while smart BMS estimates deliver convenient ongoing monitoring. By tracking SOH trends, you avoid unexpected power outages, optimise your battery‑monitor settings, and make well‑timed, cost‑effective battery‑replacement decisions.
A: A battery sitting above 90 % SOH is considered close‑to‑new condition. While 80 % SOH marks the common end‑of‑life reference point, usability depends entirely on your power requirements.
A: No. Open‑circuit voltage only reflects SOC. An aged, degraded battery can still display perfectly normal resting voltage. Always combine voltage checks with capacity or resistance testing.
A: Apparent SOH estimates may rise slightly after BMS recalibration or cell balancing. However, permanent capacity loss from chemical degradation cannot be reversed.
A: The most frequent causes include outdated capacity settings on your battery monitor, incomplete SOC synchronisation, cold operating temperatures, loose connections, cell imbalance or BMS safety shutdown events.